Summary for Leadership
Cisco has been known for offering security services for various external gatherings like the Black Hat and RSA Conferences, alongside major events such as the Super Bowl and the Olympic games. These services are provided through products like Cisco Security Cloud solutions such as Umbrella, XDR, Malware Analytics, among others, as well as the Splunk Enterprise Security software. Additionally, a team of skilled Security Operations Centre (SOC) analysts is engaged to construct and manage the infrastructure and track potential threats, both internal and external, within the event networks.
For the second consecutive year at Cisco Live APJC, the group was called upon to aid the Cisco Live Melbourne 2024 seminar. This document acts as an overview of the planning, implementation, and operation of the network, and also sheds light on some of the noteworthy discoveries made during four days of threat detection on the network.
Evaluation of SOC
The Security Operations Centre (SOC) at Cisco Live plays a crucial role in guaranteeing secure access to event services. This is achieved by closely monitoring and utilizing a variety of products to gather necessary data.
Pooling data from multiple sources within the network and devices empowers the SOC to refine the information for better comprehension of the operational environment. Synthesizing this data is vital to start the initial investigation and, if required, perform deeper forensic analysis.
To gauge the scale of operations at Cisco Live APJC, here are some statistics from the 4-day conference:
Total DNS Queries: 48,123,933
Sinkholed DNS Queries: 4,750
Applications Classified: 11,614
High-Risk Applications: 300+
Internal Traffic Volume: 320TB
Encrypted Traffic Volume: 206TB
External Traffic Volume: 314TB
Unique Internal Hosts: 4355
Unique External Hosts: 58349
Operational Risk Categories
Risk Areas in the Cisco Live Event Environment:
- Delegates and Staff Wi-Fi Access
- Essential Broadcasting Services via Cisco TV
- Critical Management Services in the NOC/SOC Operations
- Demonstration Zone in the World of Solutions
- Event Entry Management and Security Passes for Registration
Preparatory Measures
“Choosing the Appropriate Tools for the Task”
The actual setup took place a week before the event but necessitated several months of advanced planning. This involved logistical arrangements for personnel, venue layout, cloud service configurations, equipment dispatch, coordination with marketing teams, attendee registration processes, NOC Staff coordination, utilization of insights from previous events, as well as managing shift schedules and event credentials.
Workforce Allocation

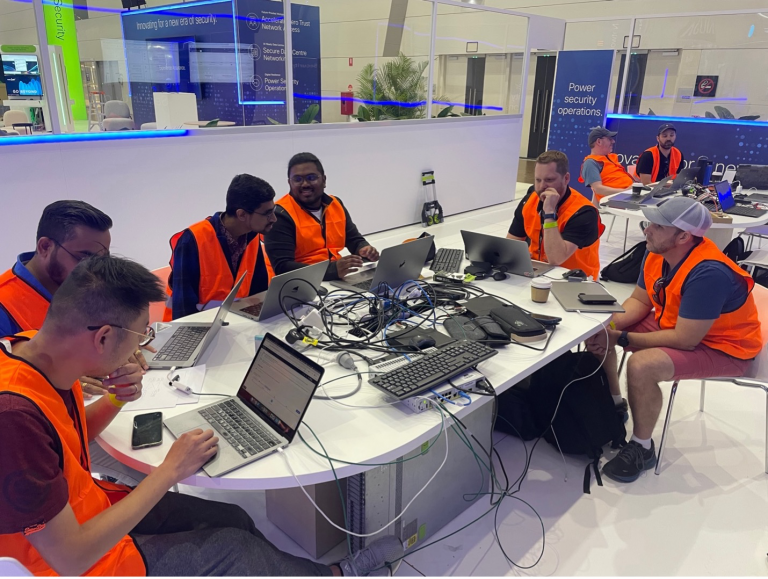
We ensured round-the-clock coverage through 2 shifts, with monitoring from 8 am till 6 pm at each workstation.
Four main stations were established with specialized focuses on TRIAGE, SANDBOX, EVENTING, and SIEM/Forensics.
All team members rotated between these stations, with support staff handling threat hunting tasks and workflow automations.
Experienced and junior analysts collaborated and exchanged insights like collectibles, fostering a collaborative and learners-friendly ambiance. Not only did this setting safeguard the visitors, but it also enabled stress-testing the platforms and showcasing their functionality, gathering user feedback for developers, all while enhancing our analytical proficiencies.
Lead Analysts:
Christian Clasen, Justin Murphy, Aditya Raghavan, Adam Kilgore, Tony Iacobelli, Jessica Oppenheimer
Trainee Analysts:
Cam Dunn, Milin Mistry, Ricky Mok, Zoltan Karczag, Alex Chan
SOC Managers:
Shaun Coulter, Aditya Sankar, Ryan MacLennan
NOC Managers:
Freddy Bello, Andy Phillips
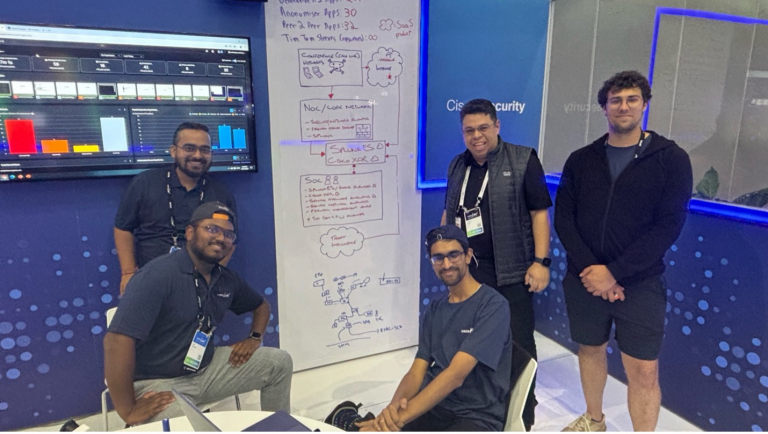
Guided SOC Tours
Throughout the event, we conducted fourteen SOC tours, with a total turnout of 140 attendees. These tours aimed to elucidate the SOC’s role at the event, operational methodologies, and share intriguing insights on our discoveries.
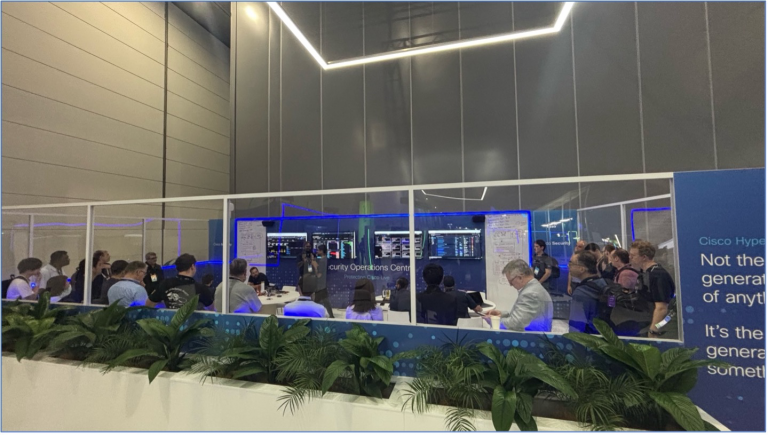
The SOC team members took turns delivering these presentations, discussing noteworthy findings from the conference.
This blog’s subsequent sections are structured versions of these SOC tour presentations, beginning with the setup and operations, outlining the key components, and sharing real-life experiences from our analysts. Stay tuned!
Infrastructure Setup and Functionality
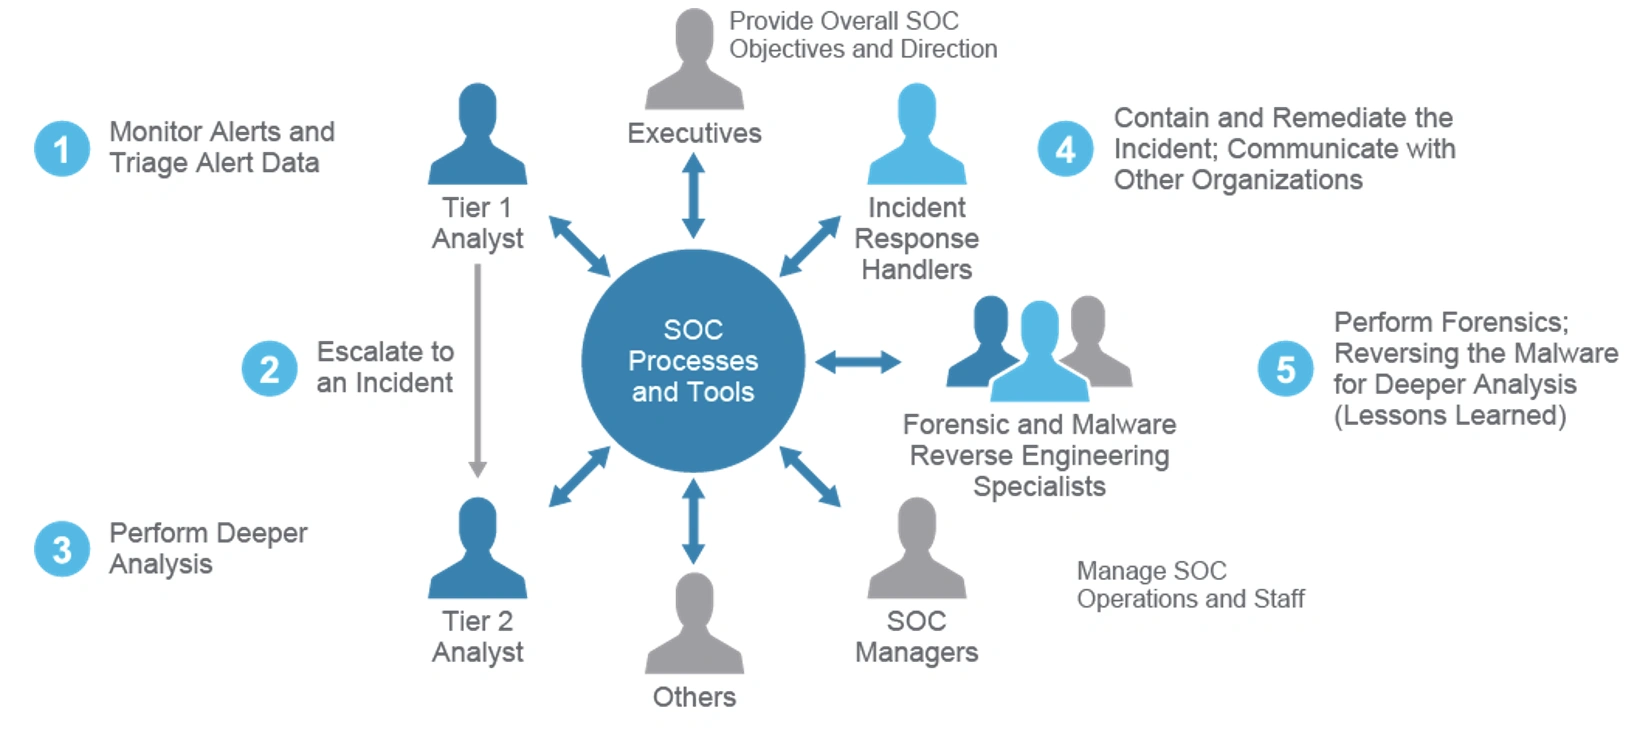
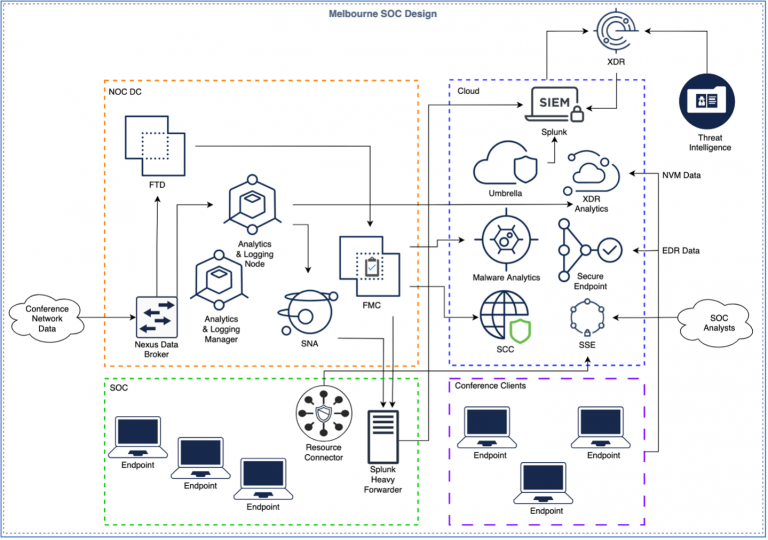
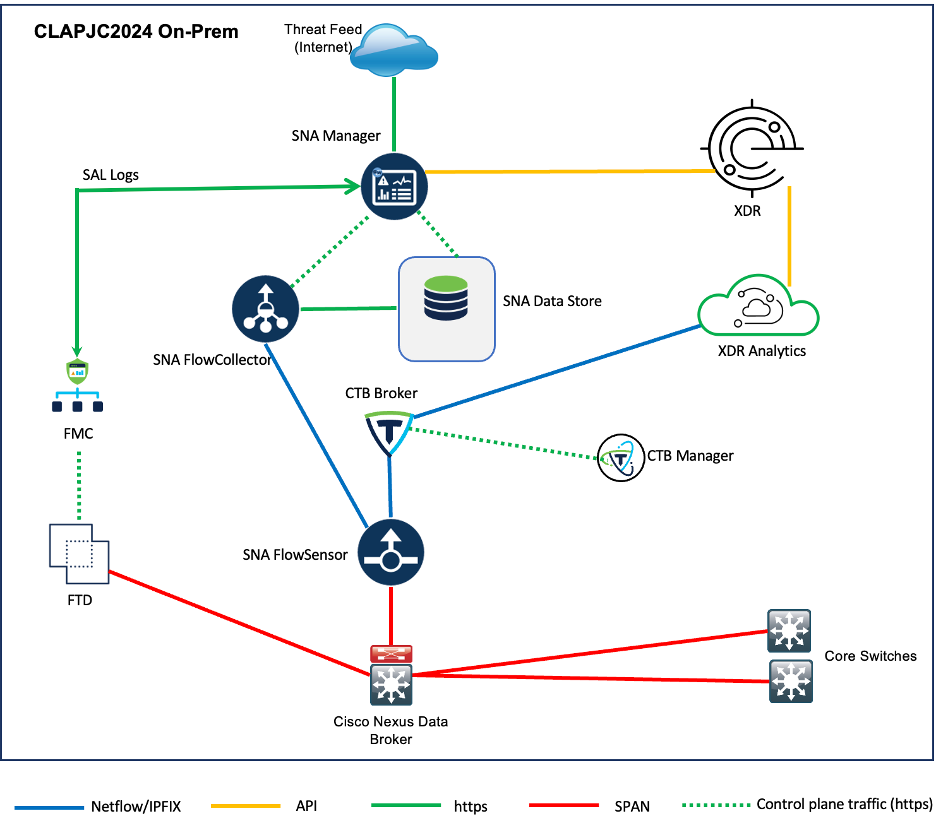
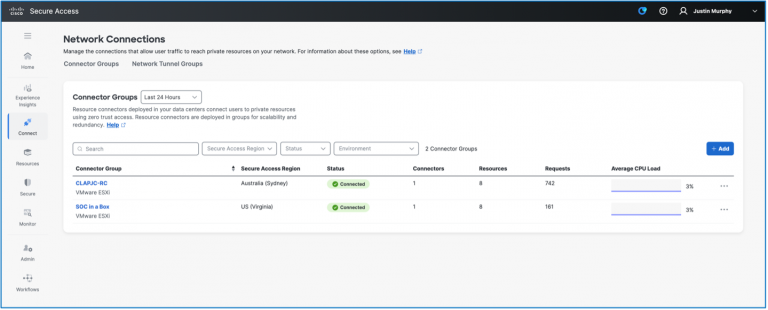
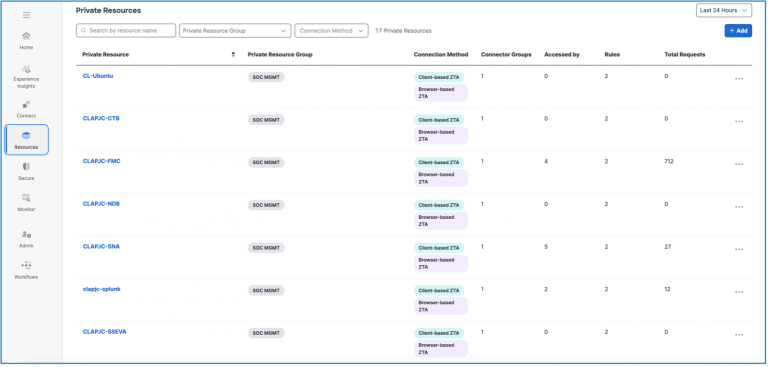
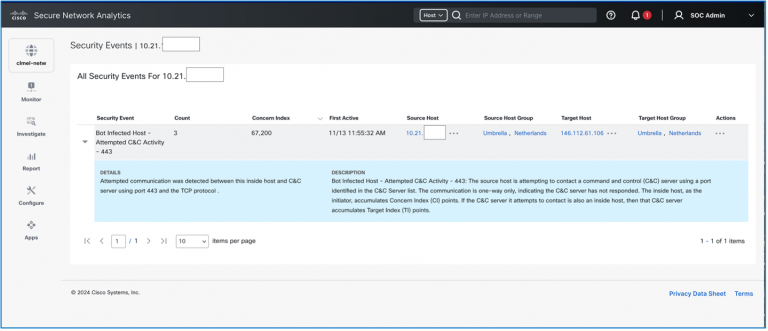
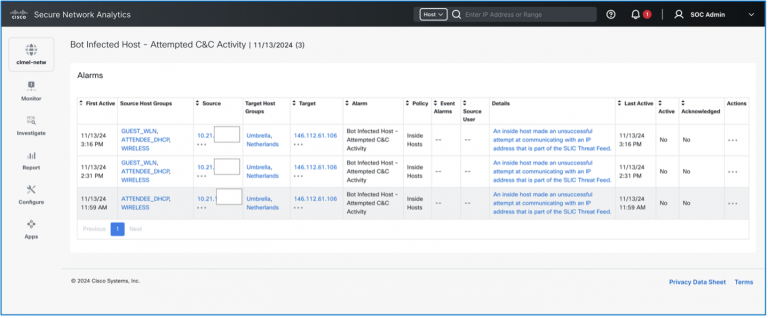
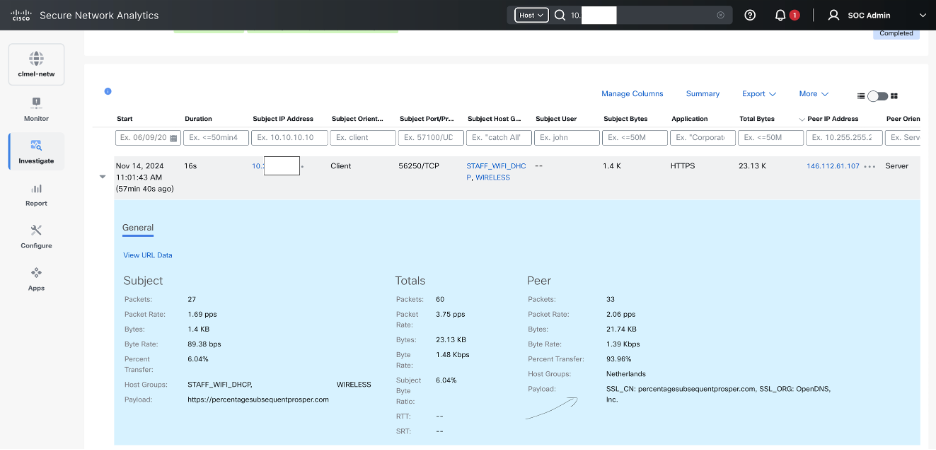
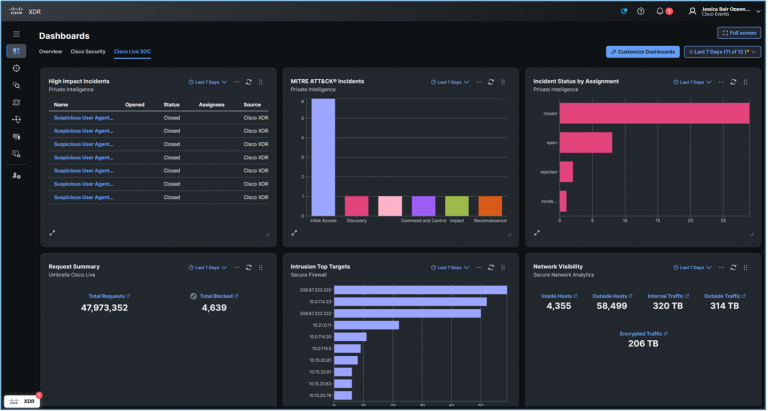
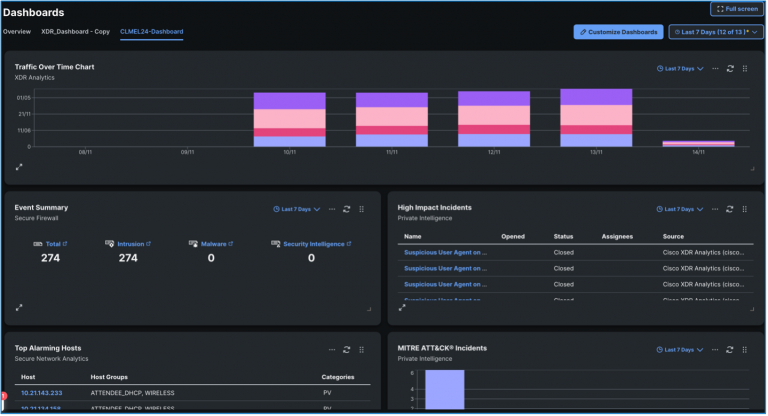
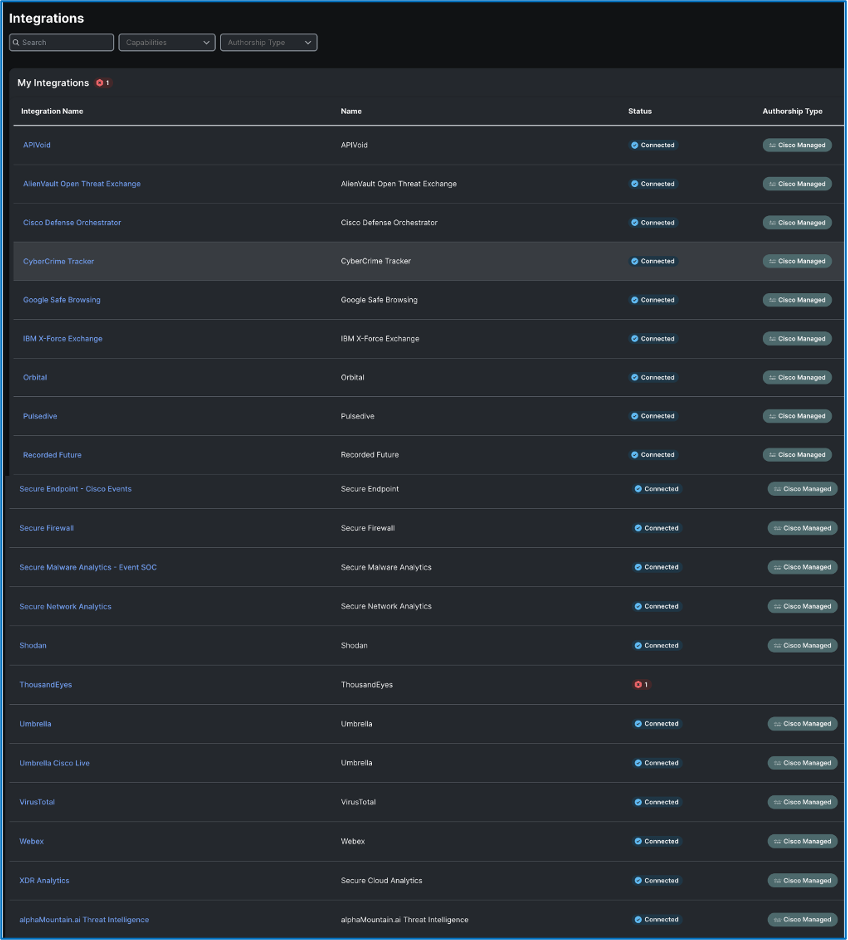
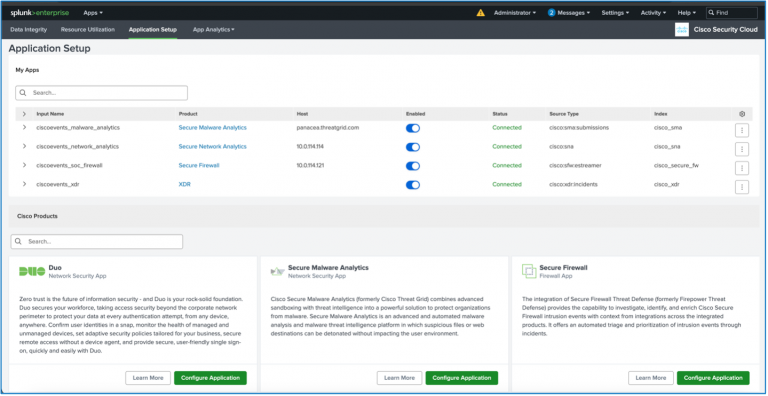
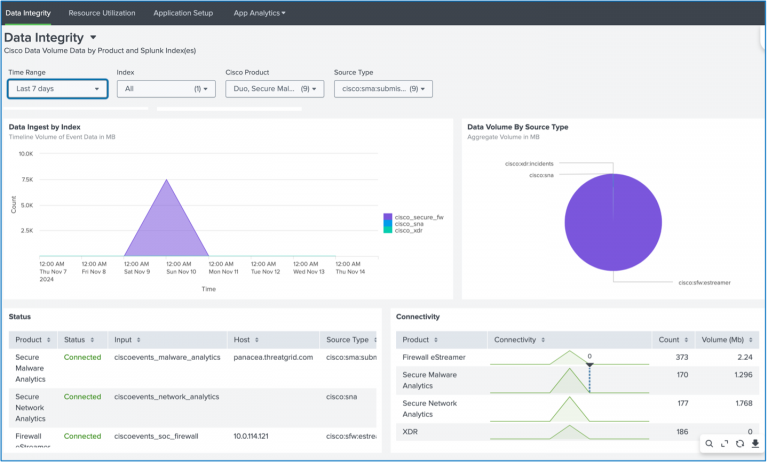
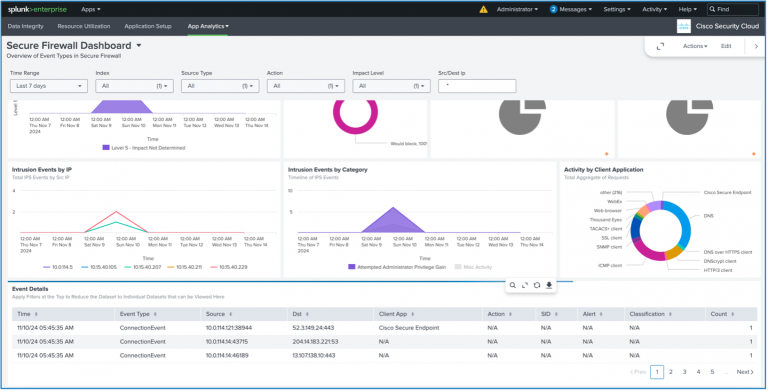
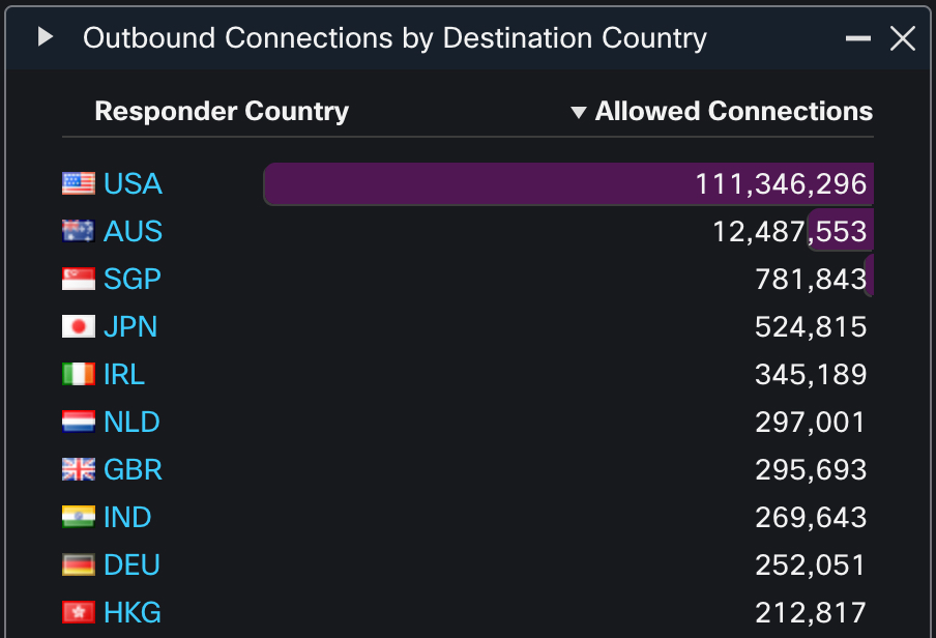
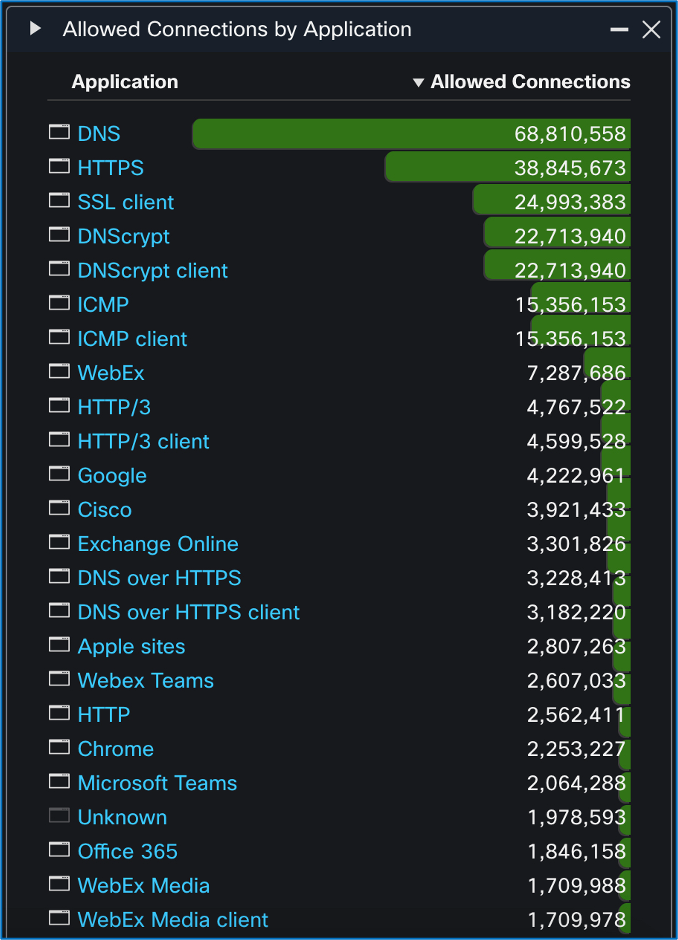
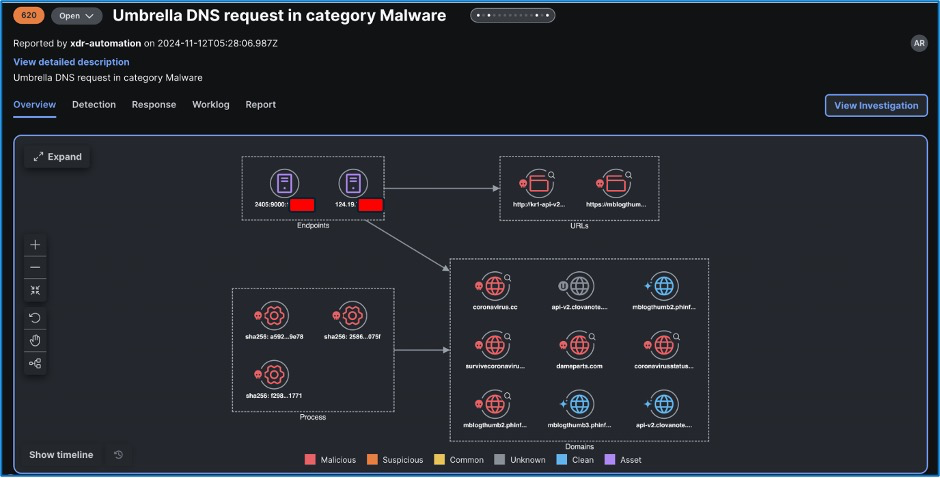
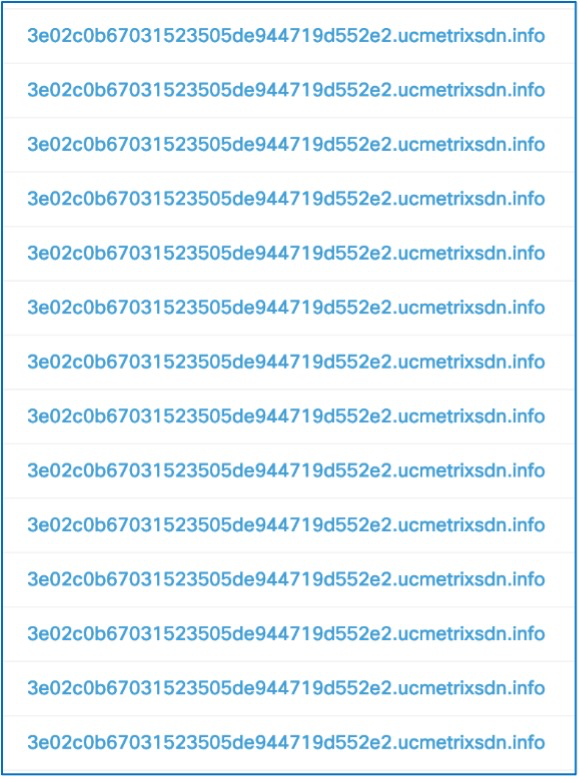
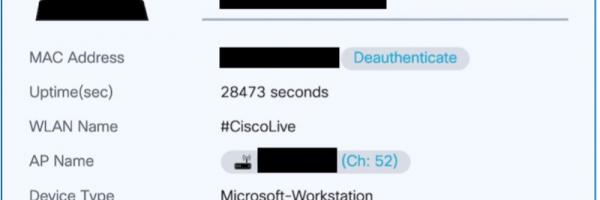
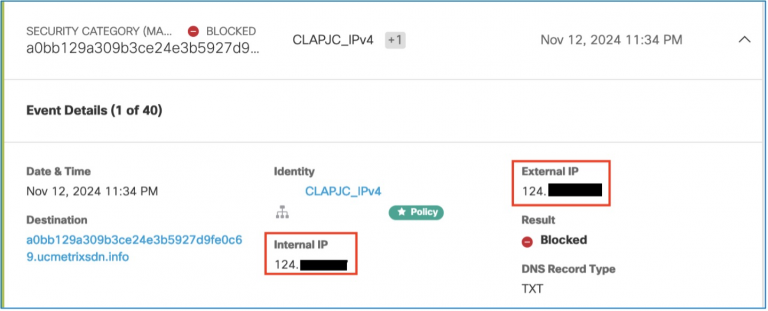
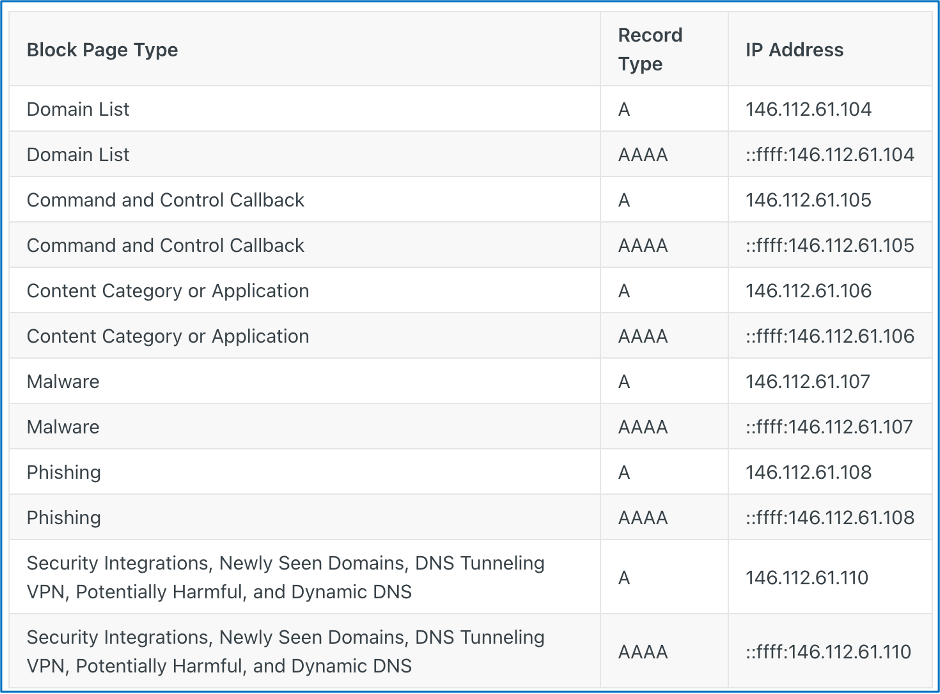
We operate a hierarchal system for initial This strategy enables XDR to efficiently gather and contextualize data, as well as offer the necessary playbook to address the incident in its current state. Within the Cisco Live SOC, this expedites the work of Tier 1 triage. The integration of Cisco XDR and Splunk ES combines and receives pertinent data from all conference infrastructure. Specifically, the following solutions were implemented to provide relevant data: Deployed on-premises: (Please note that the platforms mentioned above are available individually or as part of Cisco Security Suites, refer to the provided links for more information) The diagram below outlines the logical interconnections between the products. Examining the above image reveals the incoming conference network data at the Network Operations Center’s data center (DC) on the left side. The SOC receives conference data through a Nexus Data Broker. On the right side of the NOC DC, cloud-based products are located. Below the NOC DC, a green box contains the SOC analysts. This space not only houses us but also serves as the connection point to internal resources via Secure Access. The Secure Access Resource Connector is utilized to link to internal resources such as the Firewall Management Center (FMC) and Secure Network Analytics (SNA). Further details on this are explored in the subsequent section of this blog. In the bottom right corner, Secure Client is installed on Windows devices throughout the conference to transmit NVM and EDR data to XDR and Secure Endpoint. Finally, all products within the orange dashed box send data to XDR along with third-party threat intelligence feeds. Within the NOC DC area, the Nexus Data Broker SPAN provides the feed to a physical Secure Firewall Threat Defense (FTD) appliance. The FTD is managed through a virtual Firewall Management Center (FMC) and is not set up to enforce any security policies. Below is a summary of the configurations made: A deeper dive into each component follows. Justin Murphy Cisco Secure Access (CSA) represents Cisco’s Secure Services Edge platform. Within the SOC, we are primarily interested in its ability to allow application access from any location to any destination. To achieve this, Cisco Secure Access was set up to provide access to the on-premises platforms, namely: the Splunk forwarders, the SNA, the FTD, and the Telemetry Brokers. The images depict the configured resources that were accessed using CSA, showcasing redundant connector groups or head ends, and statistics regarding the accesses made to each of these resources. Cisco Secure Network Analytics (formerly Stealthwatch Enterprise) offers comprehensive visibility over the Conference network and uses advanced analytics to detect and respond to real-time threats. These threats encompass command-and-control (C&C) attacks, distributed denial-of-service (DDoS) attacks, unidentified malware, and insider threats. Secure Network Analytics integrates with Cisco XDR, forwarding Critical and Major security alerts from the Security Services Exchange to be analyzed by the current platform in support of investigations. These alerts are transformed into incidents containing specifics such as sightings, observables, and indicators based on the alarm metadata. For every valid IP address requested during an investigation, Secure Network Analytics provides: Besides the typical fields found in NetFlow/IPFIX records, the FlowSensor in Secure network analytics also includes additional metadata from deep packet inspection (DPI) for precise layer-7 application identification, network, and server response time metrics, as well as partial packet payload information (covering up to 256 bytes of HTTP and HTTPS request paths) necessary for forensic analysis when needed. Cisco XDR represents a cloud-based solution aimed at streamlining security operations and enabling security teams to detect, prioritize, and counter advanced threats. In the Cisco Live SOC, XDR serves as the primary triage platform. Telemetry data from all integrations is received by XDR, which aggregates and correlates events to generate an incident bundle. Unlike a traditional SIEM, XDR streamlines the search, risk assessment, and data collation processes out-of-the-box. It can be considered a plug-and-play solution, with customization options available but limited compared to our Splunk platform. We utilize XDR for initial triage and Splunk ES for further escalation, leading to effective operations by efficiently upskilling interns for operational tasks while focusing senior analysts on process improvement and escalation management. This ensures the appropriate tool is used for each task. For the Cisco Live APJC 2024 SOC, a bespoke dashboard was created in the Control Center to showcase insights from the various integrated solutions. The following are the ready-to-use integrations configured in XDR: Our Splunk stack comprised Splunk Cloud and Splunk Attack Analyzer. Splunk Cloud included Splunk Enterprise Security (ES) and the Cisco Security Cloud apps. As our security infrastructure involved on-premises appliances like the Firewall Management Center and the Secure Network Analytics Manager, transferring on-premises data to the cloud was necessary. To achieve this, we set up a UCS M3 server on-site. Once the server was up, we deployed a compact Ubuntu virtual machine and installed Splunk on it. The Cisco Security Cloud app, available on the Splunk base app store, is a unified app to bring data from Cisco Security tools to Splunk. It’s modular, enabling configuration for individual products to ingest data into Splunk, including Secure Malware Analytics, Firewall, Secure Network Analytics, Cisco XDR, and more. The app includes pre-configured dashboards for each product and health monitoring of the app to track data ingestion levels. It transforms ingested data to Splunk’s Common Information Model (CIM), a universal schema for data indexing, facilitating cross-data set visualizations and field searches across telemetry types. With the Cisco Security Cloud app set up to ingest data from multiple sources, we installed the universal forwarder app to establish connections with the Splunk cloud deployment. The universal forwarder proved highly efficient, forwarding large volumes of data to Splunk cloud without exceeding 30% CPU usage or experiencing significant ingest delays. This enabled SOC analysts to search data in Splunk cloud, where Enterprise Security was also installed. Notable incidents from XDR were automatically populated as alerts in Splunk ES. In the Cisco Secure Firewall (CSF) deployment at Cisco Live Melbourne, we have an Intrusion Detection System (IDS) setup that takes in a TAP from the current network and security infrastructure utilized during the conference. The CSF serves as the ingestion point for other security solutions in use by our Security Operations Center (SOC), collecting important data, producing logs and events that feed into tools like Cisco Splunk and Cisco XDR. Additionally, CSF retrieves files from unencrypted sessions for further analysis in Secure Malware Analytics sandbox. While operating in passive IDS mode has limitations in terms of visibility, such as the inability to leverage TLS Server Identity for extracting extra details from HTTPS connections and the restriction on general decryption, the firewall still offers essential alerting capabilities. The vast amount of data points captured for each connection played a pivotal role in many investigations, notably highlighted in the sections ‘Sifting Traffic with Secure Firewall’ and ‘Malware Callouts from the Show Floor’. Regarding geolocation data, Cisco Live attendees predominantly exhibited connections back to the USA, overshadowing other destinations significantly. Australia, as the host country, also demonstrated a notable presence with twelve million connections. While no other country exceeded a million connections, the rest of the list displayed an expected dominance of regional and global technological spots. This predictability in geolocation preferences of the attendees enabled us to delve deeper into uncommon inbound and outbound geolocation connections, aiding in expanding multiple investigations following the discovery of an initial event. Despite the potential for masking geolocation data for malicious activities via Tor, VPN, or compromised hosts in other countries, traffic aligned with anticipated geolocation patterns still undergoes scrutiny through signature, heuristic, and sandbox analyses. Geolocation is just one of several facets that can expose attack patterns. Furthermore, we monitor application data at a broader level, alongside individual alerts for malicious domains. Although plaintext attacks and information leaks persist at each conference, their occurrence rate has gradually declined. Notably, at Cisco Live Melbourne 2024, HTTPS was preferred over HTTP at a ratio of 15:1. The adoption of HTTP/3 is also on the rise. Additionally, the trend of using DNS over HTTPS to obfuscate DNS requests is noteworthy. Despite the prevalence of plaintext DNS requests, the adoption of DNS over HTTPS continues to climb. It is expected that plaintext DNS requests will eventually be overshadowed by encrypted DNS protocols, akin to the transition from HTTP to HTTPS. Written by Aditya Raghavan In the realm of automation, we have introduced three fresh automation workflows to expedite threat hunting for our analysts. Credit goes to Ivan Berlinson, our associate from France, for the first two workflows in XDR automation integrating with Secure Malware Analytics, and to Adi Sankar for the workflow involving Umbrella. 1. Malicious samples submission in Secure Malware Analytics Our aim is to minimize the number of dashboard transitions our analysts must undertake. Therefore, whenever samples submitted to Secure Malware Analytics are confirmed as malicious (with a threat score > 90) and observed inIn the Cisco Live setup, this automated process would promptly generate an incident in XDR and dispatch a Webex message to the Incidents channel. The above serves as an illustration. While not a routine task in a live environment, it aids in highlighting intriguing paths of inquiry within XDR and Webex for our analysts. 2. Innocuous examples from prevalent document formats Likewise, at such gatherings, we commonly observe contents being transmitted in plain text. Documents of standard file types submitted to Secure Malware Analytics with a non-malicious outcome (threat score < 85), witnessed in the Cisco Live setup, and falling under the following categories generally contain text in plain sight. This merits an inquiry for our analysts to ascertain if any crucial data unintentionally leaked. This process would automatically spawn an incident in XDR and transmit a Webex message to the Incidents channel for documents of the listed file formats. 3. Generating incidents from Umbrella Security Events Instances of DNS Security Events in Umbrella pertaining to particular areas of interest would be escalated to the analyst as separate incidents by category. This demonstrates an instance of an automated incident created for the Malware category. By Christian Clasen A few days into the conference, we detected multiple block events in Umbrella DNS. These events involved TXT record queries for seemingly randomly generated subdomains linked to ucmetrixsdn[.]info. The queries mimic the domain generation algorithm (DGA) method frequently employed for malware communication. The DGA technique is a characteristic of a command and control (C&C) infrastructure typically serving one of two objectives: fetching instructions from the malware’s operators or exfiltrating data from the infected endpoint covertly. As this malware is widely recognized (initially identified in 2018), we can leverage public intelligence to compile anticipated behaviors and additional signs of compromise to commence our examination. The DGA behavior observed here aligns with the CoinLoader malware. Dark Trace published a comprehensive article that provided us with some guidance: https://darktrace.com/blog/catching-coinloader-decrypting-the-malware-hijacking-networks-for-cryptomining-operations. We immediately sought answers to the following questions: CoinLoader serves as an initial dropper intended to download additional malicious payloads such as ransomware, data thieves, and crypto miners. It seemed that this specific infection was likely in its nascent phase, and Umbrella effectively curbed further infection stages by obstructing the C&C traffic. No interactions were logged between this device and other attendee IP addresses, nor any reconnaissance activities, indicating that the risk to other participants was presumed to be minimal. CoinLoader lures victims by posing as cracked or pirated variants of legitimate software. To verify if the malware was acquired on the conference network, we scoured our SOC tools (including Secure Malware Analytics and Firewall file events) for RAR and ZIP file extensions, and any instances of filenames containing “keygen” or “crack.” No evidence suggested that the malware was downloaded during the conference. Due to the encryption of attendee traffic, this certainty remained unattainable. To pinpoint and inform the device owner, we employed standard fingerprinting methods. DHCP logs and traffic patterns proved invaluable in deducing the OS and device category. In this instance, MDNS queries originating from the device divulged both the OS classification and hostname. The hostname included the attendee’s first name. Leveraging data from the wireless infrastructure, we successfully pinpointed the device location on the exhibition floor. Following user notification and device evaluation, we proceeded with an extensive search for related IOCs elsewhere on the network. Our hunt included: By utilizing Splunk, we efficiently combed through all our log sources for these IOCs and found no other instances of this infection. Nathan Quentin In real-world scenarios, practical implementations often deviate from the idealistic configurations envisioned by manufacturers. Restrictions such as events, financial limitations, and time constraints frequently thwart the deployment of comprehensive security infrastructures. Faced with these challenges, analysts must resort to correlation methods to maximize the insights obtainable within the Security Operations Center (SOC) environment. One particular constraint encountered at the Cisco Live SOC was the absence of Umbrella Virtual Appliance (VA) integration, resulting in a blind spot in client-side IP visibility. Despite the lack of VAs, analysts managed to attribute potentially malicious or dubious DNS queries to client IP addresses on the public Wi-Fi network by leveraging their understanding of Umbrella operations. Umbrella functions as a recursive DNS resolver that harnesses the capabilities of the global DNS system to enforce security protocols and acceptable usage policies. The public IP addresses assigned during the conference are associated with an Umbrella organization, facilitating the attribution and enforcement of suitable policies for DNS queries. Due to Network Address Translation (NAT), all IPv4 queries are traced back to the public address that serves all conference attendees. In an ideal Umbrella deployment, internal recursive resolvers (VAs) would be in place to provide internal IPv4 attributions. Regrettably, the internal resolvers used at the conference lacked this functionality, resulting in only public IP address attributions in Umbrella alerts. The most straightforward solution to this dilemma would involve incorporating the internal recursive resolver logs into our Security Information and Event Management (SIEM) and Security Orchestration, Automation, and Response (SOAR) systems. Although this solution was in the works and undergoing active development, it was not immediately accessible during the initial phases of the conference. So, how could this gap be closed to ensure the availability of the most precise information for these incidents? The answer is uncomplicated for those familiar with Umbrella’s functionality. When Umbrella identifies a query targeting a malicious domain, it does not merely reject resolution or return an NXDOMAIN response. Instead, it directs the query to dedicated IP addresses owned by Cisco and awaits the subsequent connection to present a blocking page. For HTTP/S connections, this approach effectively communicates to the end user why their connection was thwarted. Umbrella reserves distinct IP addresses for categories such as Malware, Phishing, and Command and Control traffic. These addresses can be found at https://docs.umbrella.com/deployment-umbrella/docs/block-page-ip-addresses. Armed with this insight, there are two methods for correlating Umbrella DNS events with Firewall incidents. By filtering the Firewall connections for the destination IP address linked to Umbrella Malware blocks (146.112.61[.]107), we can pinpoint any connections attempted by the client following the resolution of the malicious domain. If these connections occur over HTTP or HTTPS, it is highly probable that the hostname can be identified in the HOST header or Server Name Indication (SNI) extension field, as the client presumes it is connecting to the intended malware server rather than Umbrella. For non-web traffic, it is possible to align the timestamp from the Umbrella event with the IP connection in the firewall logs to confidently identify the specific internal client IP responsible for the malicious or suspicious DNS query. Geolocation data from the wireless infrastructure can then aid in locating devices and persons when the alert’s content justifies such actions. Aditya Raghavan, Adam Kilgore The narrative began when Adam detected a series of SSH sessions originating from an IP within the DC static host group range towards internal IP addresses on an unconventional port (TCP 830). Initially, all these connections were successful, suggesting legitimacy. Further exploration using XDR Investigate revealed that another adjacent device from the Infrastructure Management host group was also engaged in similar traffic flows between the devices in the Infrastructure Management and DC Static host groups, triggering multiple Snort alerts on the firewall.
Architecture of SOC
Cisco Secure Access
Cisco Secure Network Analytics
Cisco XDR
Splunk
Secure Firewall Threat Defense
Automations


Analyst Narratives
CoinLoader Infection Inquiry
Approaches to Identify Clients on Public Wireless Networks

Data Harvesting from Infrastructure Servers
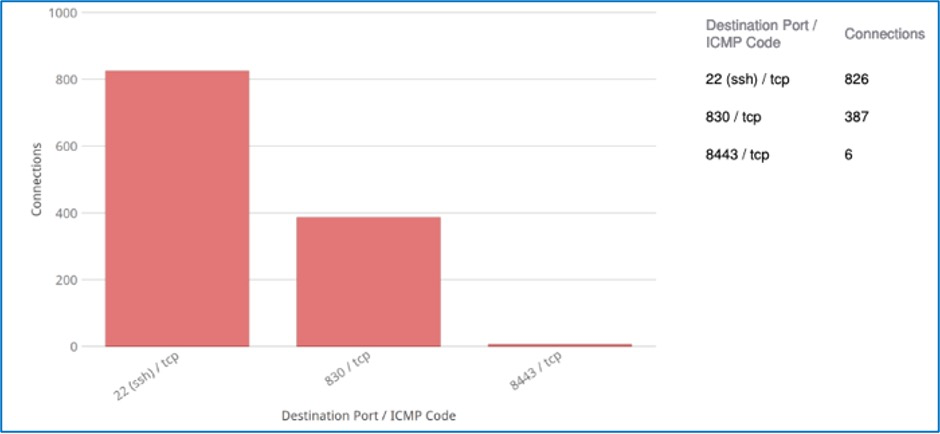
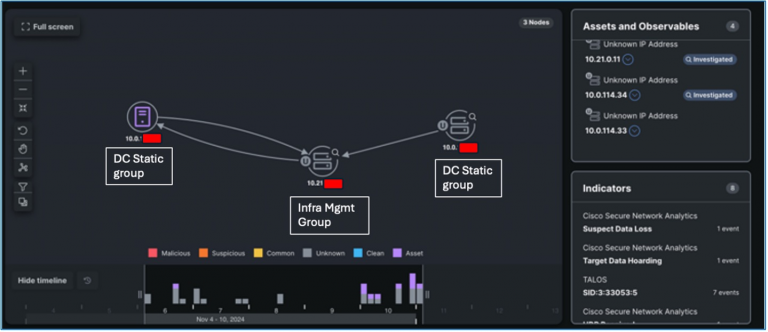
Analyzed traffic patterns were verified by Secure Network Analytics via Fake Application Detected alerts. Following this, the NOC team was informed about this incident as the Infra Management realm fell within their purview.
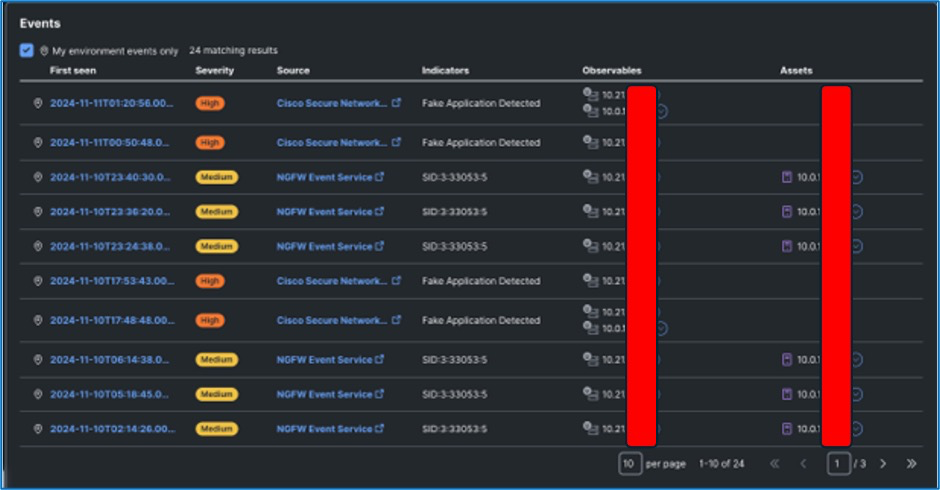
An investigation was carried out by Freddy Bello, the NOC lead, leading to the identification of Wireless LAN controller (part of Infra Management) and DNA Spaces Controllers (in DC Static) as the entities involved. The observed traffic pattern, which featured SSH on an non-standard port, was attributed to an application on the controller that was conducting telemetry extractions related to the status of access points in the exhibition area.
The traffic, despite appearing unusual at first, turned out to be part of expected operations. This incident exemplifies the workflow of SOC in scrutinizing abnormal traffic trends that may indicate compromise or malicious activities if not validated as legitimate. By nurturing a close collaboration with the NOC, valuable insights on traffic behaviors are shared, aiding in discerning if further investigation is warranted or if the case can be closed securely. Ultimately, this incident proved to be a Cisco Live Positive. Ready to hunt down the next anomaly.
Incident of Suspected Data Loss and Port Misuse
The NOC alerted the SOC about certain activities they detected on their WAN router:
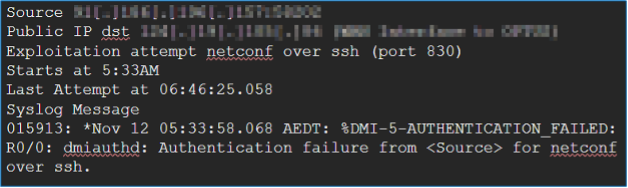
These activities were blocked by an ACL on the WAN router, preventing them from reaching the firewall and, consequently, escaping the attention of the SOC.
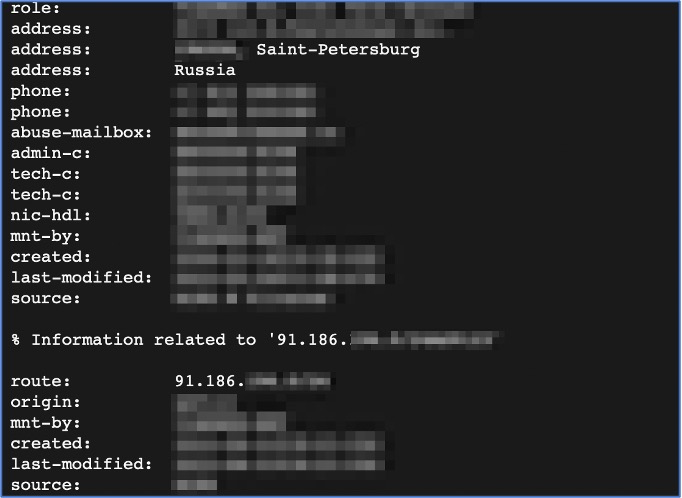
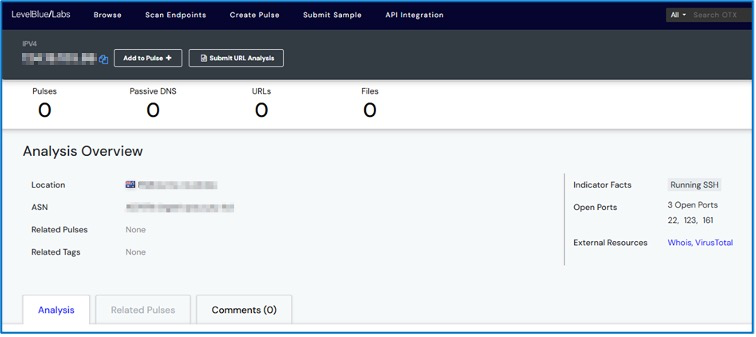
A reverse IP lookup revealed that the suspicious traffic originated from Russia:
Following this event, the NOC conducted its own probe, leading to the discovery of an XDR incident on 12/11/2024, under the title as mentioned earlier. Refer to the screenshot below:
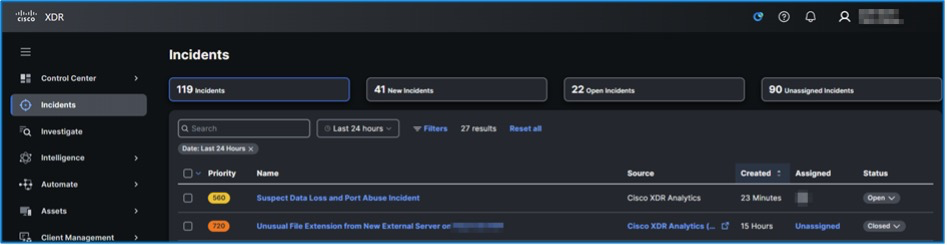
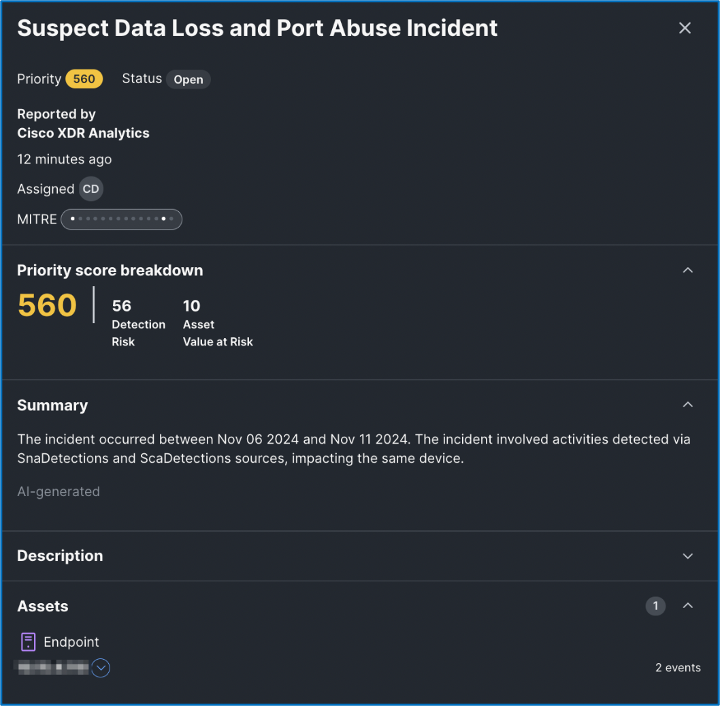
Further examination confirmed that the NOC carried out a port scan from an internal IP address to the WAN link.
Another positive outcome from Cisco Live.
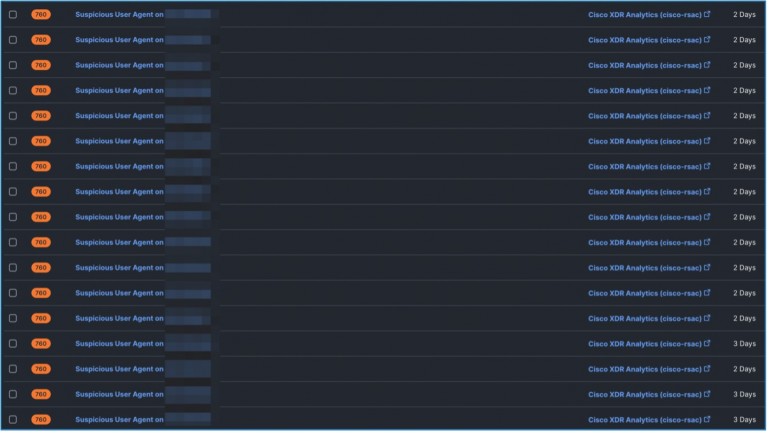
Suspicious User Agent on <internal IP address>
Investigated by Christian Clasen, Zoltan Karczag, Cam Dunn, Ricky Mok
Several occurrences flagged in XDR regarding dubious user agent activities across various IP addresses within the local Cisco Live event IP address range.
A detailed investigation revealed that the behavior was likely due to an (possibly Android) application with an erroneous implementation of the OkHTTP client library (https://square.github.io/okhttp/). The developers of the application failed to correctly set or invoke the “project.version” variable in their app.
It is speculated that this activity may be linked to processes running on the e-commerce platform https://open.lazada.com/
The server side employs Octopus.https://octopus.com/docs/octopus-rest-api
Examination through Secure Malware Analytics reveals the following:
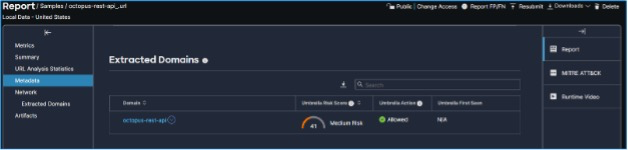
Using XDR Investigate:
We have decreased the priority in Network Analytics on the questionable user agent to minimize the quantity of alerts in XDR for the legitimate benign user agents identified.
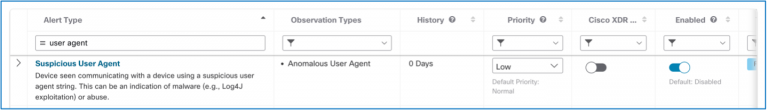
A more precise refinement could be achieved by obstructing/filtering the particular observed user agent.
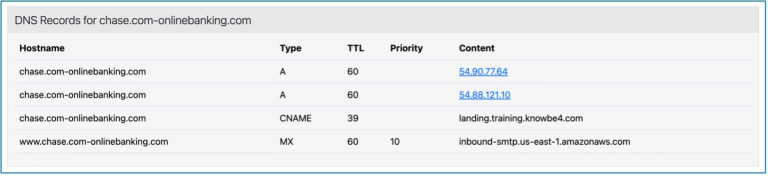
Suspected Phishing Domain
Adam Kilgore, Zoltan Karczag, Tony Iacobelli
- Cisco XDR Alerted on a potential phishing domain that was identified by a host on the network
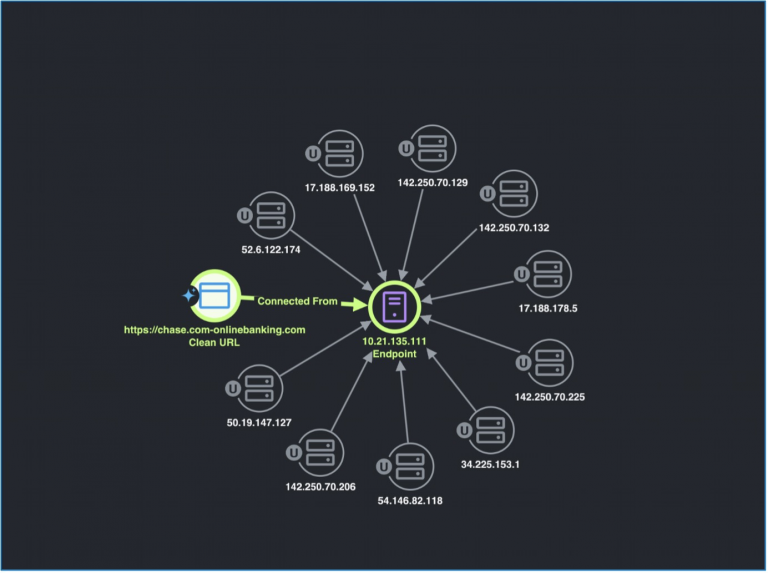
The SOC utilized Splunk Attack Analyzer to engage and assess the website in a secure manner, investigation revealed a “404 page not found” site during the URL assessment.

Through additional inquiry, we were able to confirm that the top-level domain and related public IP were possessed by “knowbe4” which is a security business specializing in phishing simulation and education.
Based on this, we identified potential Cisco Live participants who had recently failed their organization’s phishing evaluation.
Sifting Traffic with Secure Firewall
Adam Kilgore
A considerable amount of contemporary analytics work is powered by automation, and understandably so—the Melbourne SOC significantly benefited from the advanced correlation provided by the Cisco Splunk and Cisco XDR platforms. The vast data observed and gathered by Cisco Secure Firewall plays a vital role in supplying those advanced analytics platforms. Moreover, the data holds inherent value on its own, and I firmly believe in inspecting datasets for the unforeseen.
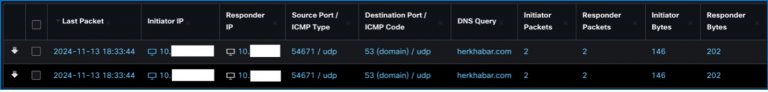
We can verify unexpected traffic by challenging assumptions. An assumption we could test is that port 443 traffic equates to HTTPS. Secure Firewall provides the logging, application identification, and search detail to confirm, employing a query similar to the following:

If the search yields no results, then our hypothesis is validated—all the 443 traffic in our logs corresponds to HTTPS. However, if the search does yield logs, then there may be something worth delving into, or at the very least, something we should comprehend. For Melbourne Cisco Live, our search did reveal some logs:
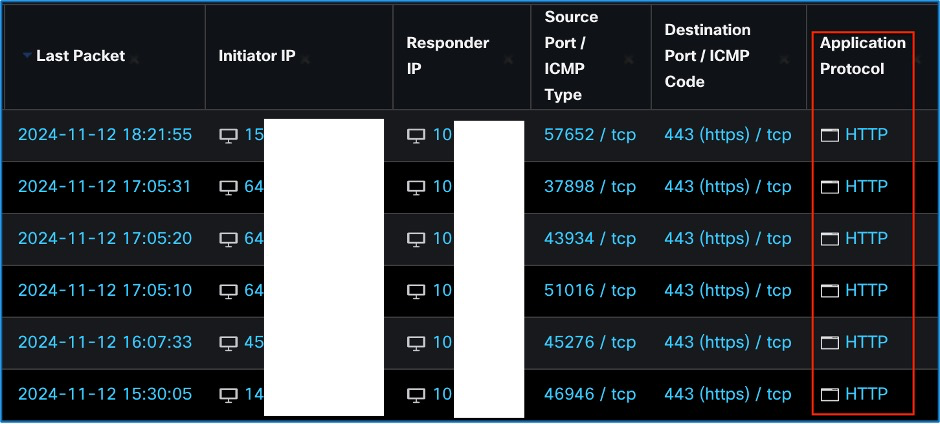
It is evident from the data above that we have some HTTP activity occurring on port 443. This is unexpected and warrants further investigation to determine the reason behind it and whether there are any security risks associated with it. Given that the traffic is using HTTP protocol, we should focus on examining the URL field provided in the logs.
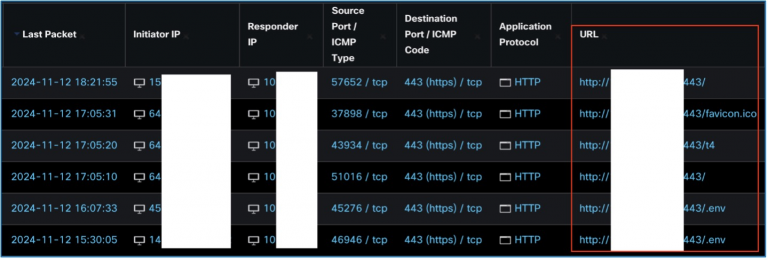
The listed URLs contain a destination IP and port 443, some with added paths. Notably, the “env” path, if misconfigured, can expose critical information leading to server compromise and potential security breaches. By isolating unexpected HTTP traffic on port 443 from the larger set of HTTPS traffic, we can focus on threats with a higher probability of malicious intent.
Analyze and Investigate
Two key actions can be taken based on this information: firstly, identifying additional malicious behaviors associated with the same actors, and secondly, verifying if the “env” requests successfully extracted sensitive data from the servers. To address the former, tracking activity from identical IP addresses is a basic approach, though attackers can mask IPs using various methods. Conversely, for the latter, continuity of attack analysis can be done by examining distinctive identifiers like user agents across different IP traffic. By doing so, we may link multiple attacks to a single actor, despite IP alterations by the attacker.
Determining the Attack Impact
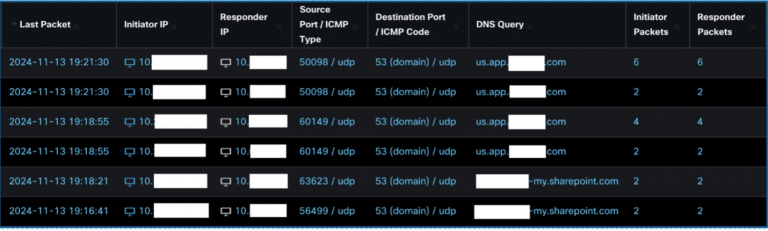
In the absence of packet captures, assessing the attack’s success can still be achieved by utilizing firewall logs. Expanding the log search to include packet and byte details allows for a more comprehensive understanding of the attack and its outcomes.
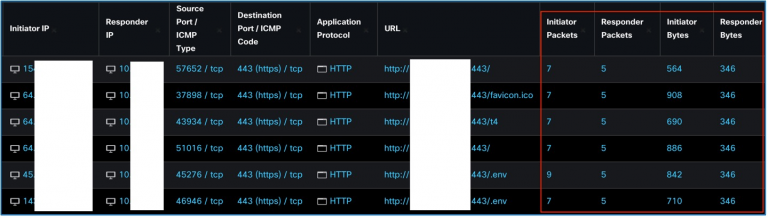
Insight from Packet Analysis
Examining packet data reveals that most connections involve seven Initiator Packets for HTTP, consisting of SYN, SYN/ACK, and a GET request. The server’s responses, particularly concerning the “env” requests, can uncover potential data leaks and unauthorized access. Analyzing Responder Packets and Bytes can unveil patterns indicative of sensitive information compromise.
Unencrypted Communications
Insecure Data Exposure
During routine assessments, we often encounter vulnerable communications where confidential data is transmitted over unencrypted channels. Identifying and securing such transmissions is critical to safeguarding sensitive information. Common examples include using unsecure protocols like HTTP instead of HTTPS for network communications.
Secure Network Practices
Effective Network Monitoring
Secure communication gateways must be prioritized to prevent data breaches and uphold privacy standards. Vigilant monitoring and prompt action can avert potential security incidents, ensuring a secure networking environment.
Protecting Data Integrity
Integrity of Data Transfer
Data integrity and confidentiality must be maintained through secure transmission channels and encrypted communication protocols. Swift identification and rectification of potential vulnerabilities are crucial in preventing data breaches and ensuring a resilient cybersecurity posture.
< p > Seek the symbol of a safe association in your browser and examine your email preferences to make sure POP3 or IMAP are not erroneously selected. < /p >
< p > We also employed the Glovebox feature in Secure Malware Analytics to probe the websites that conference attendees attempted to connect to, such as this confiscated domain by the authorities. < /p >
< div class = "wp-block-image is-style-default" > < figure class = "aligncenter size-large is-resized" > < img loading = "lazy" src = "https://storage.googleapis.com/blogs-images-new/ciscoblogs/1/2025/02/secure-malware-seized-domain-768x337.png" alt = "" class="wp-image-468954" width = 768 height="338" srcset = "https://storage.googleapis.com/blogs-images-new/ciscoblogs/1/2025/02/secure-malware-seized-domain-768x337.png 1024w, https://storage.googleapis.com/blogs-images-new/ciscoblogs/1/2025/02/secure-malware-seized-domain-300x132.png 300w, https://storage.googleapis.com/blogs-images-new/ciscoblogs/1/2025/02/secure-malware-seized-domain-768x337.png 768w, https://storage.googleapis.com/blogs-images-new/ciscoblogs/1/2025/02/secure-malware-seized-domain.png 1439w" sizes=" (max-width: 768 px) 100vw, 768px" / > < /figure>
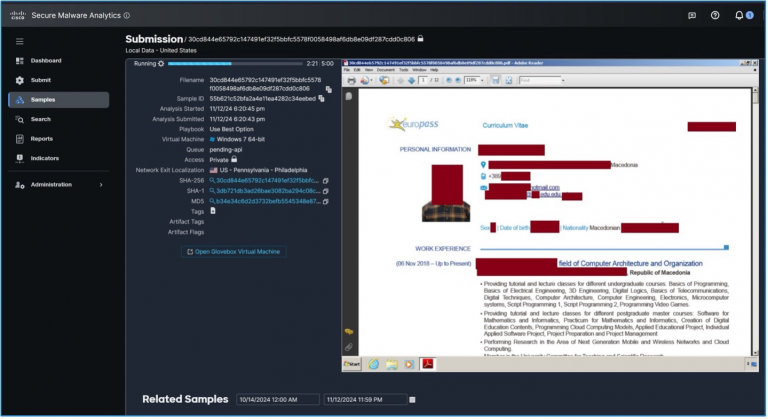
< p > We had the capability to analyze the conduct of websites (such as delivering malicious JavaScript files) without putting our analysts at risk of infection. < /p >
< div class = "wp-block-image is-style-default" > < figure class = "aligncenter size-large is-resized" > < img loading = "lazy" src = "https://storage.googleapis.com/blogs-images-new/ciscoblogs/1/2025/02/secure-malware-analytics-report-768x396.png" alt = "" class="wp-image-468955" width = 768 height="396" srcset = "https://storage.googleapis.com/blogs-images-new/ciscoblogs/1/2025/02/secure-malware-analytics-report-768x396.png 1024w, https://storage.googleapis.com/blogs-images-new/ciscoblogs/1/2025/02/secure-malware-analytics-report-300x155.png 300w, https://storage.googleapis.com/blogs-images-new/ciscoblogs/1/2025/02/secure-malware-analytics-report-768x396.png 768w, https://storage.googleapis.com/blogs-images-new/ciscoblogs/1/2025/02/secure-malware-analytics-report.png 1439w" sizes=" (max-width: 768 px) 100vw, 768px" / > < /figure>